By Brian Petersheim
In the entire year of 2018, there were 2,041 homes sold in Maricopa. Of those homes sold 1,927 of the homes were located in Maricopa’s subdivisions led by Home Owner’s Associations. Only Five percent of the homes sold in Maricopa were in areas not guided by HOAs.
I wanted to do a break down of the price per sq. ft. average of each of the subdivisions. Please note that many factors play into these average numbers. The two factors that have the most weight in the averages below are:
- The number of sold homes compiled in the average. For instance, in the entire year of 2018, only 8 homes sold in the subdivision of Palo Brea. A single low sales price will affect the average more than other areas.
- The subdivisions where new home construction is occurring may have a higher average because the builders sell their homes at a higher price per sq. ft. than a resale home!
| Subdivision | Average price/ sq. ft. |
| Acacia Crossings | $104 |
| Alterra | $96 |
| Cobblestone | $104 |
| Desert Cedars | $93 |
| Desert Passage* | $98 |
| Glennwilde* | $103 |
| Homestead* | $106 |
| Lakes @ Rancho | $102 |
| Maricopa Meadows | $88 |
| Palo Brea | $87 |
| Province* | $136 |
| Rancho El Dorado | $105 |
| Rancho Mirage* | $110 |
| Santa Rosa* | $106 |
| Senita | $89 |
| Sorrento* | $101 |
| Tortosa | $94 |
| Villages | $99 |
*These subdivisions have new builds being sold
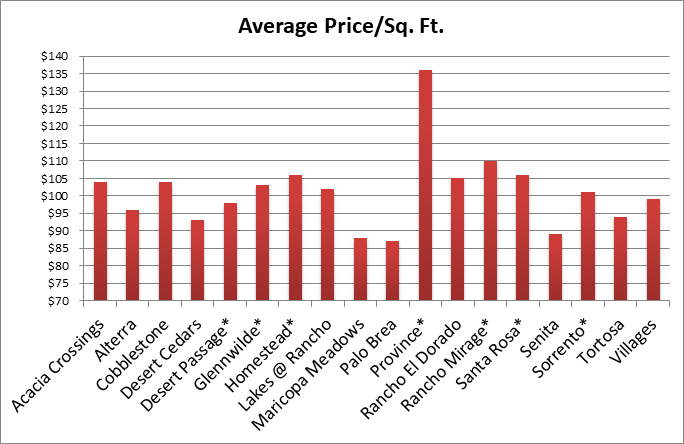
Please note: These are averages. Your home may be above or below the average. Your home may be highly upgraded, or have a pool. Single vs. two-story can make a huge difference. Every property should be looked at individually by a licensed local Real estate agent to get a more precise valuation.
Brian Petersheim is a Real estate agent with Homesmart Success.
602-206-9644
[email protected]





![Alleged car thief released without charges Phoenix police stop a stolen vehicle on April 20, 2024. [Facebook]](https://www.inmaricopa.com/wp-content/uploads/2024/04/IMG_5040-218x150.jpg)
